1853 Stockholm Cholera Outbreak Analysis
Project Information
- Category: Public Health Analytics / Historical Data Analysis / Data Visualization
- Client: Quantum Analytics (Internship Project)
- Project Date: Nov 2023
- Tools Used: Tableau, Microsoft Excel, Microsoft Power Query (for Data Cleaning & Text Analysis)
- Data Source: National Archives of Sweden (Church Records - Death Records), Statistics Sweden (Contemporary Report)
- Project URL: View on Tableau Public
Cholera Outbreak, Stockholm, 1853: A Data-Driven Glimpse into a 19th Century Pandemic
Summary
During my Quantum Analytics internship, I analyzed the devastating 1853 Stockholm Cholera outbreak using challenging historical handwritten church death records. Initially, a quick scan revealed the data was in Swedish, leading me to perform a straightforward translation using Excel. However, even after this initial step, I encountered persistent inconsistencies, realizing that not all information had been accurately or completely translated. This immediately prompted me to delve deeper, embarking on more robust text analysis within Power Query to meticulously clean and standardize the remaining unstructured details. This layered approach was crucial for transforming the raw, multi-language historical data into a usable format for comprehensive analysis. This project showcased my ability to tackle significant data cleaning hurdles, including language barriers, to illustrate the rapid, traumatic effects of a 19th-century urban pandemic.
1. Introduction: Unearthing a 19th-Century Public Health Crisis
The 1853 Cholera outbreak profoundly impacted Stockholm, claiming 3% of its population in weeks, with poor areas like S:t Catherine parish hit hardest. My Quantum Analytics internship project aimed to visualize this historical tragedy. A major hurdle was the primary data: handwritten Swedish church death records. Initially, I misidentified the Swedish entries as inconsistencies, attempting complex text analysis to decipher them. Through my problem-solving process, the straightforward need for translation became clear. This experience underscored the importance of comprehensive problem-solving. Post-translation, I used Power Query for further data cleaning and text analysis to transform this "dirty," unstructured data into a compelling visualization of the pandemic's speed and societal trauma.
2. Project Objectives & Goals
My project aimed to extract and visualize critical insights from this challenging historical dataset:
Overall Objectives:
- Quantify the daily and weekly mortality burden of the 1853 Cholera outbreak.
- Analyze the demographic characteristics (age, gender) of the deceased.
- Visualize the geographical spread and impact across Stockholm's parishes.
- Demonstrate advanced data cleaning and text analysis techniques for historical, unstructured, and multi-language data.
Project Goals & Deliverables:
- Mortality Trend Visualization: A time-series chart showing daily/weekly cholera deaths.
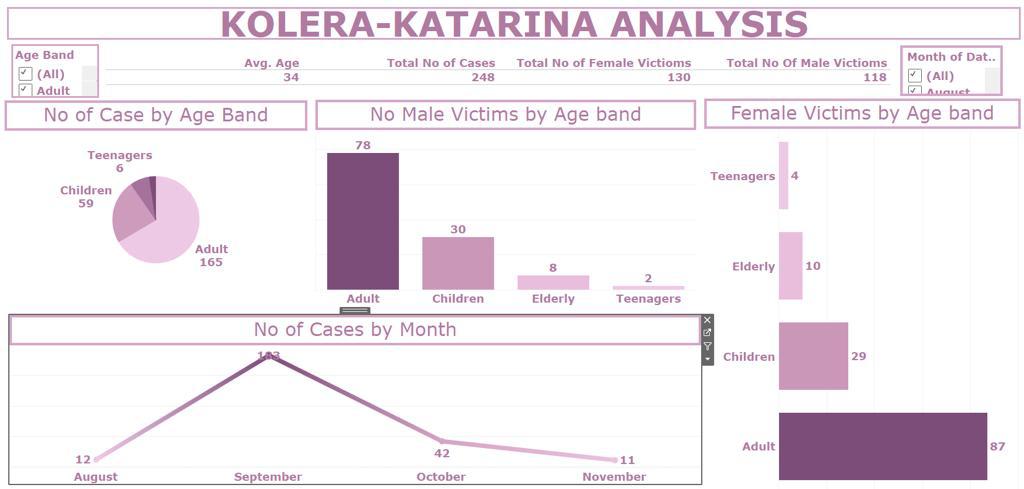
- Demographic Impact Analysis: Bar charts or distribution plots for age and gender.
- Geographical Impact Map: A choropleth map of Stockholm's parishes highlighting mortality rates.
- Data Quality & Cleaning Showcase: Explain the "dirty data," the Swedish language confusion, and the translation/Power Query methods.
- Interactive Dashboard: A comprehensive Tableau dashboard for data exploration.
3. Data Scope & Metrics (Inferred)
The project utilized historical death records from Stockholm's church archives, focusing on the 1853 Cholera outbreak. After extensive cleaning and translation, the dataset likely contained: Date of Death, Parish/Location, Age at Death, Gender, and Cause of Death (specifically "Cholera"). Additional inferred attributes like Name/Identifier and Socioeconomic Indicators (from occupation/address) were valuable for cleaning or contextual understanding. The primary challenge was the "dirty" nature and initial Swedish language of the handwritten records, necessitating significant preprocessing, starting with **translation**, then **text analysis in Microsoft Power Query** to standardize information and transform unstructured text into usable quantitative data.
Key Insights Derived from Data:
- Rapid Mortality Escalation: Time-series visualization clearly showed a sharp increase in daily deaths at the peak.
- Disproportionate Impact on Vulnerable Areas: Geographical mapping highlighted higher mortality rates in poorer parishes like S:t Catherine.
- Age and Gender Susceptibility: Analysis revealed specific age groups and potential gender variations in mortality.
- High CFR Confirmed: The volume of fatalities aligned with cholera's high Case Fatality Rate.
- Problem-Solving & Data Transformation: The project demonstrated overcoming data challenges, from language barriers to unstructured formats, using methodical translation and Power Query.
- Lessons for Public Health: The rapid spread and severe impact emphasized the importance of modern sanitation and rapid response.
4. Dashboard Design & Key Insights
My Tableau dashboard was designed to narrate the epidemic's story through compelling visualizations:
Dashboard Features and Insights:
- Daily Mortality Time Series: A line chart showing deaths per day.
- Demographic Breakdown: Bar charts for age groups and gender of the deceased.
- Parish-Level Impact Map: A map shading parishes by mortality rates or total deaths, highlighting hotspots.
- Key Figures Display: Summary cards for total deaths, peak daily deaths, and population affected.
- Interactive Filters: Date and parish filters for granular data exploration.
- Data Journey Narrative (Optional): Explaining the raw, dirty, Swedish data, initial confusion, translation, and Power Query process.
- Tooltip Details: Informative tooltips on all charts.
The dashboard served as a powerful educational tool, vividly illustrating the 1853 public health crisis and underscoring advancements in sanitation and medicine.
5. Technical Approach & Tools
This project's challenging nature stemmed from its historical data:
- Data Acquisition: Raw data came from handwritten Swedish church death records from the National Archives, implying digital acquisition and transcription.
- Initial Data Assessment & Problem Identification: The Swedish entries were initially mistaken for transcription errors, leading to an attempt at text analysis in Power Query.
- Problem Solving & Translation: Through my problem-solving process, the core issue was identified: direct translation from Swedish to English was needed, proving to be the most effective first step.
- Further Data Cleaning & Preprocessing (Microsoft Power Query): Post-translation, Power Query was crucial for subsequent text manipulation, including:
- Splitting columns, extracting patterns, cleaning inconsistencies, and standardizing entries.
- Converting text to appropriate data types.
- Handling missing or unclear entries.
- Geocoding (if applicable).
- Exploratory Data Analysis (EDA): Initial analyses in Excel and Power Query's preview pane helped understand data structure and identify outbreak peaks.
- Data Visualization & Dashboarding (Tableau): Cleaned data was imported into Tableau for visualization, creating calculated fields, various charts, and an interactive dashboard for Tableau Public.
6. Impact & Business Value
This project offers unique value:
- For Historical Epidemiology & Public Health Research: A data-driven case study of a 19th-century pandemic.
- For Archival & Digital Humanities: Showcases the potential of analyzing digitized historical records.
- Demonstrates Advanced Data Cleaning Skills: Highlights proficiency in handling dirty, unstructured data, including problem identification, collaborative problem-solving, and efficient data transformation using Power Query's text analysis.
- For Urban Planning & Social Studies: Provides insights into how socio-economic factors and infrastructure influenced historical disease vulnerability.
- Storytelling with Data: Illustrates the ability to transform challenging data into a compelling narrative.
7. Conclusion
My "Cholera Outbreak, Stockholm, 1853" project at Quantum Analytics was profoundly challenging yet rewarding. Dealing with handwritten Swedish church records, initially confounded by the language and dirty data, I leveraged my problem-solving skills, including translation, and Power Query's text analysis. The resulting Tableau dashboard effectively visualizes the rapid spread, demographic toll, and geographical impact of the outbreak. This project significantly enhanced my skills in handling unstructured, multi-language data and creating powerful historical narratives, demonstrating my ability to overcome significant data challenges to derive meaningful insights.